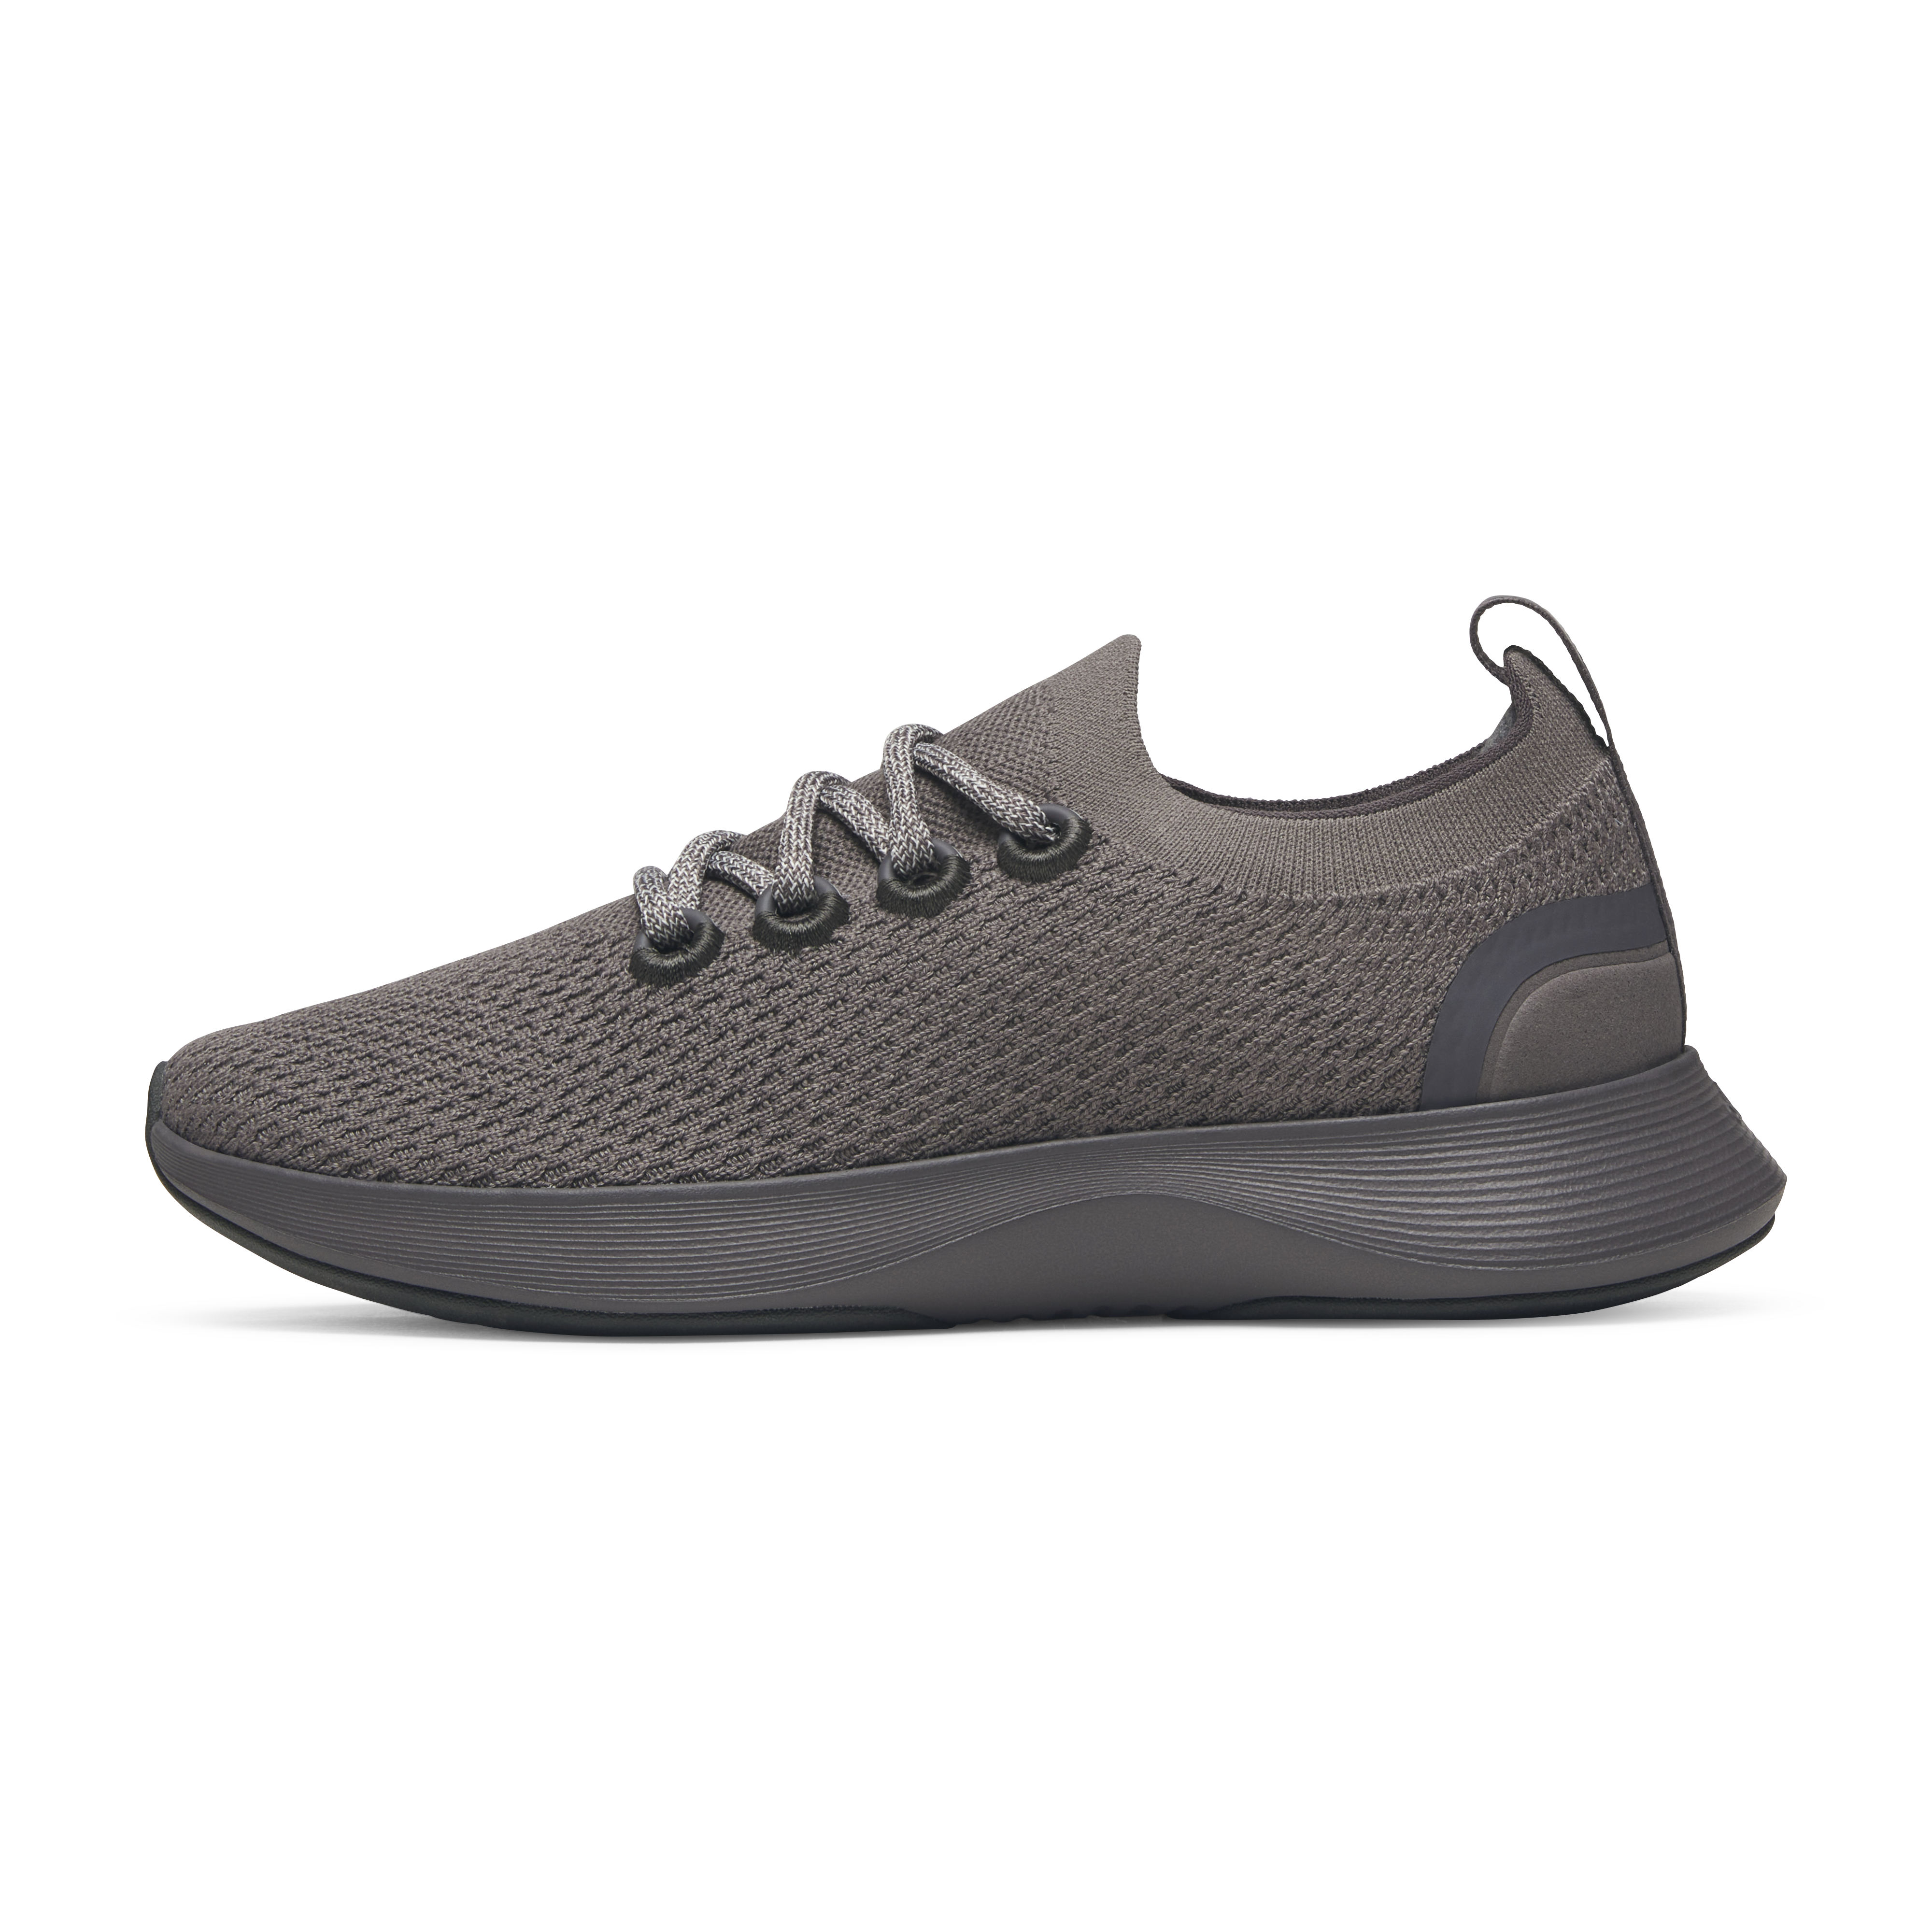
Men's Dasher NZ
13.65kg CO₂eEstimate · medium confidence
The median pair of shoes in our catalogue has a carbon footprint of 13.3 kg CO₂e over its whole life, from growing or making the materials to disposal. Half of the 422 shoes and other footwear we have footprinted, from 28 brands, fall between 13.3 and 14.8 kg CO₂e.
In the typical split, production makes up about 52% of the total, followed by raw materials at about 43%. The split shows where a maker's own data changes the result most: replacing published averages for the largest stages with your own figures moves the footprint far more than refining the small ones.
The split is the median share of each stage across the catalogue's shoes and other footwear, rescaled to add up to 100%. Read cradle to gate versus cradle to grave for what each stage covers.
The main material is the biggest single choice in a pair of shoes's raw-material footprint. These are the main materials of the shoes and other footwear in our catalogue, by share of products:
For each product, our calculator tests common changes and reports the one with the largest saving. For shoes and other footwear, the changes that come out on top most often are:
Share of shoes and other footwear for which each change gives the largest saving.
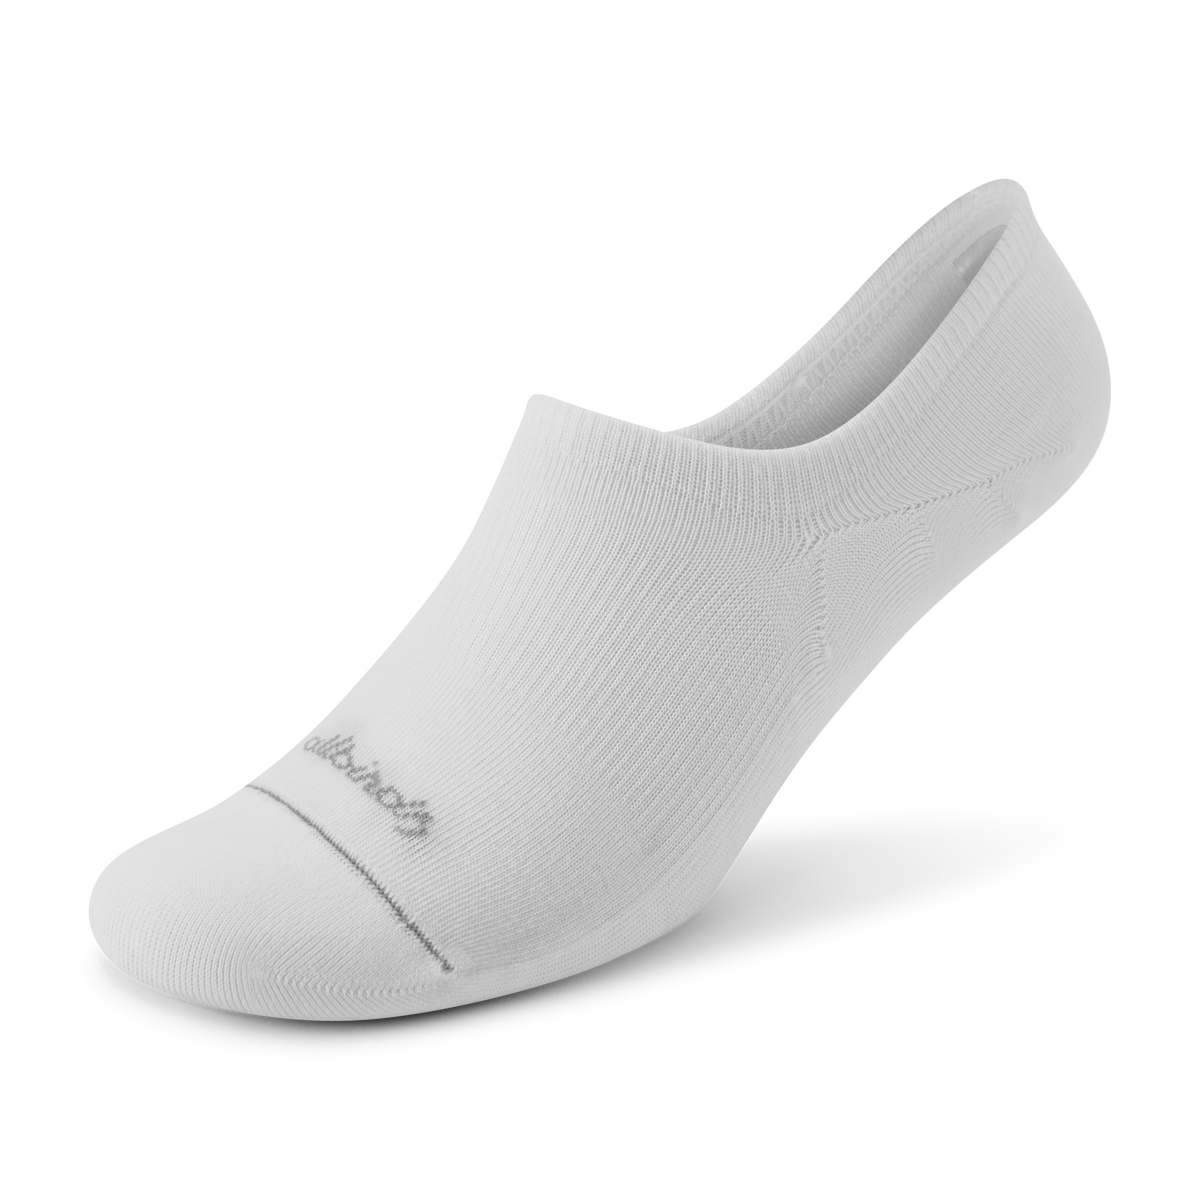


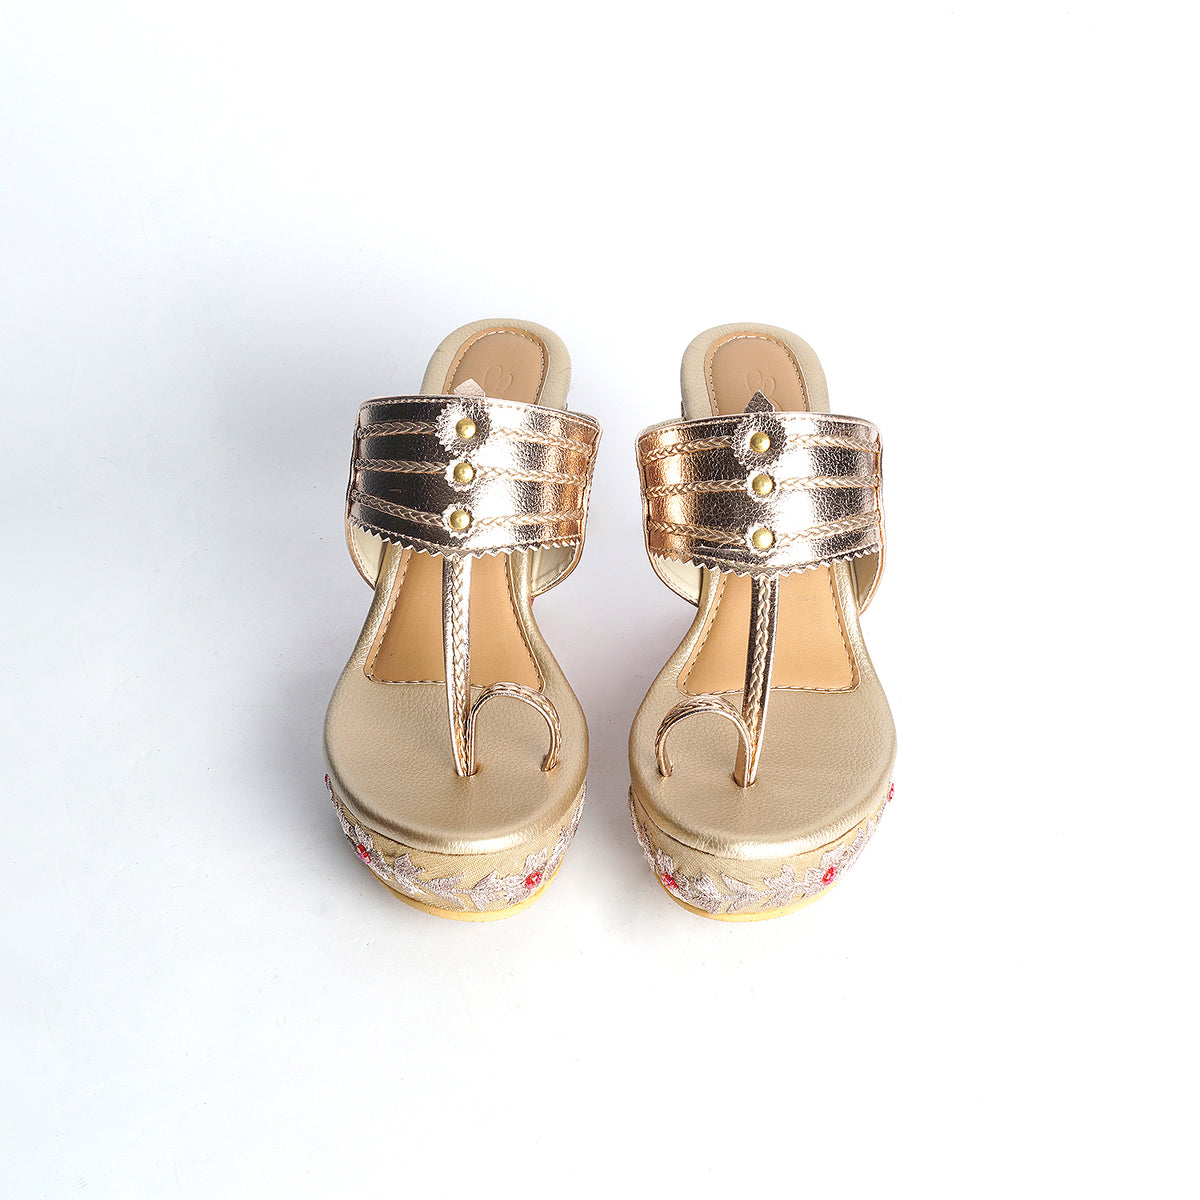
Each product's footprint is a screening estimate: we read the materials and weight from the product listing, apply emission factors from cited public sources, and follow the ISO 14067 method with every source shown. Without the maker's own energy and supplier data, these are typical values, not measurements of a particular factory.
To footprint your own pair of shoes, start with a free estimate from a product link, or enter your own factory data. See our methodology for the method and sources.
Across 422 shoes and other footwear in our catalogue, the median footprint is 13.3 kg CO₂e per item over its whole life, and half fall between 13.3 and 14.8 kg CO₂e. These are screening estimates from product listings; your own product's figure depends on its materials, weight and factory.
In the typical split, production is the largest stage at about 52% of the total, followed by raw materials at about 43%.
Counting only raw materials, production, inbound transport and packaging, up to the factory gate, the median is 13.0 kg CO₂e per item. Buyers often ask for this figure for their Scope 3 inventory.
The change our calculator most often finds with the largest saving for shoes and other footwear is “run the factory on solar electricity”. The best change for your product depends on your own materials and energy.
Use them to see the size of the footprint and where it comes from. For a figure to send a buyer, footprint your own product with your materials, weight and factory energy, so the result describes what you make.