Footprinting a whole catalogue, not one product
By Made for Planet Carbon team • • 5 min read
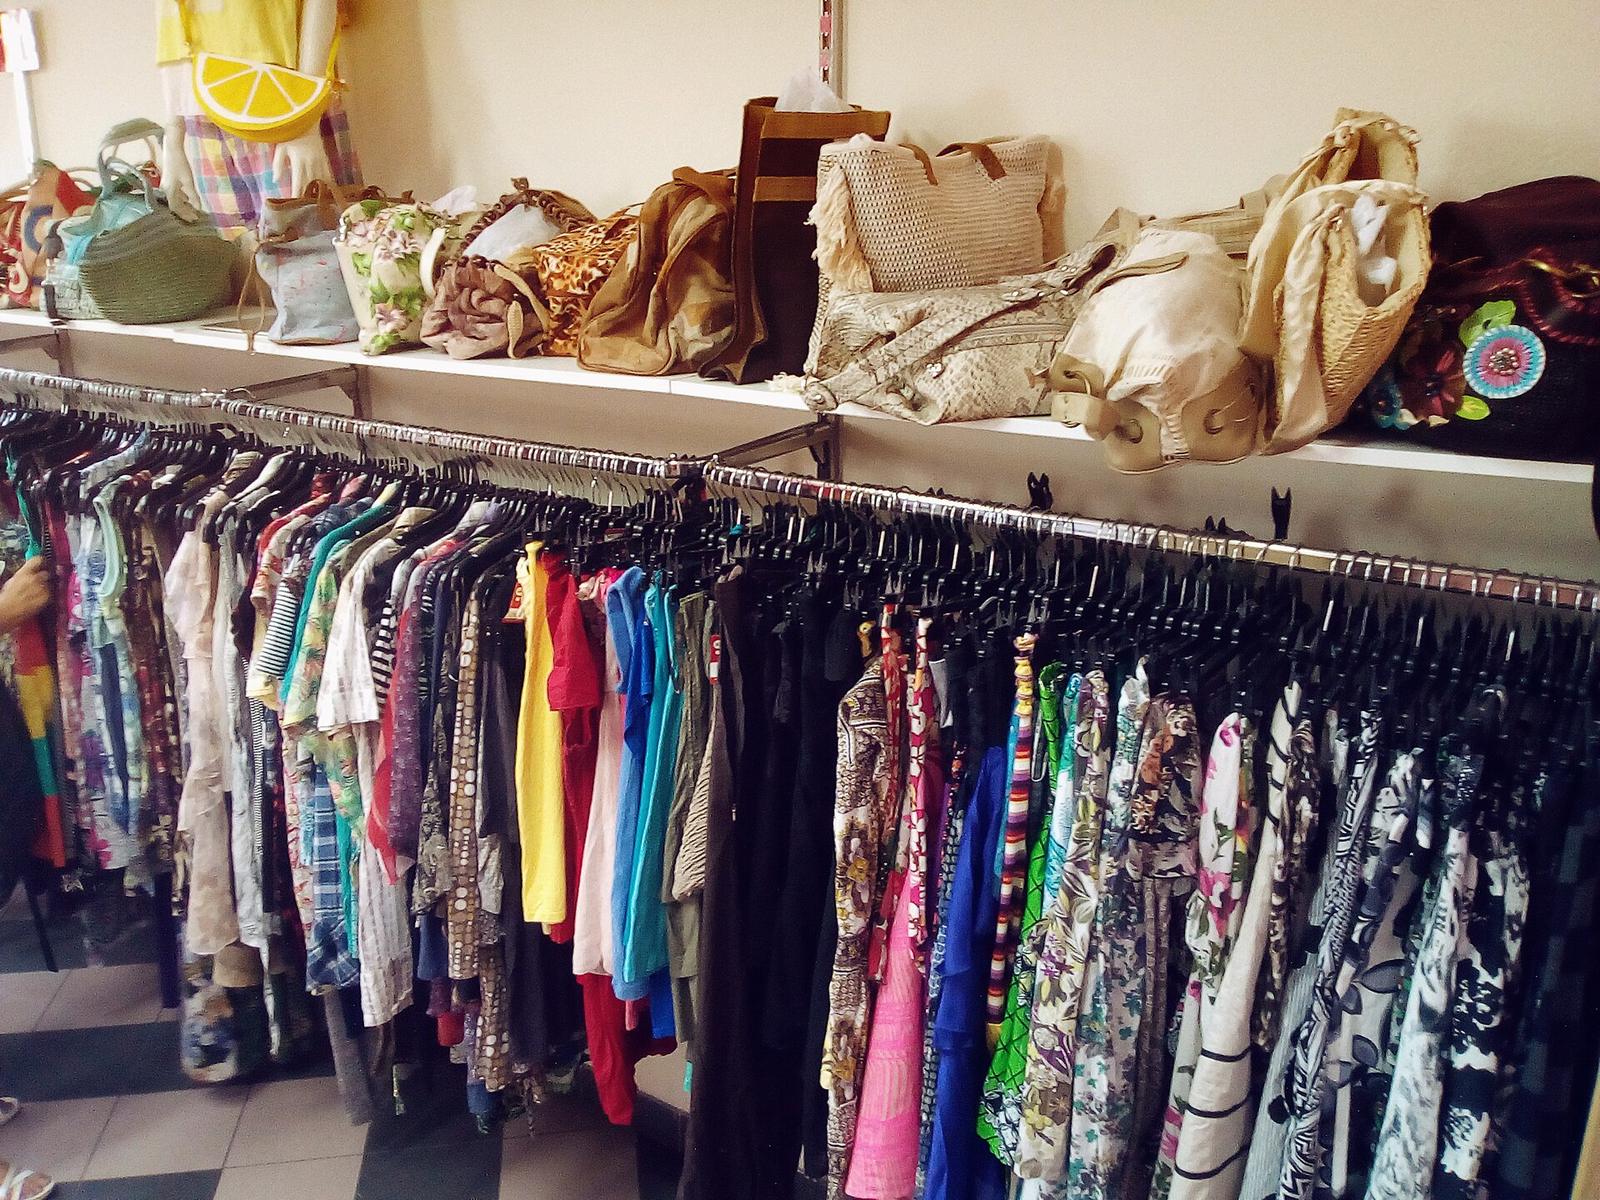
One product footprint answers one customer request. Brands increasingly want figures for everything they buy, and suppliers with hundreds of styles cannot afford a study for each. The answer is to footprint the whole range first, then deepen where it matters.
- 1Upload your listExcel or CSV
- 2Check what we readMaterials, weight, country
- 3Fill the gapsOnly what is missing
- 4Deepen the top sellersWith your own data
Start from the list you already have
Most suppliers keep a product list with names, materials and weights for orders and catalogues. That is enough for a first footprint per product. Upload it as Excel or CSV: each row gets a footprint, and rows with something missing are listed with exactly what to add.
Check, do not guess
A first pass reads materials, shares, weights and countries from your text. Nothing should be calculated until you have confirmed what was read, so a typo does not turn into a wrong figure. Defaults that are used are recorded, so your buyer can see them.
Where to add your own data
- Top sellers: the products your biggest customers buy most.
- Products with big hotspots: where one stage dominates, your own data changes the answer most.
- Factory energy: one year of bills improves every product made in that factory.
Prepare your product list
- One row per product or style, with its name.
- Materials with percentages, as on the care label.
- Weight of one item in grams.
- Country of manufacture.
- Optional: category, product code and packaging.
Keep the catalogue up to date
Footprints should be updated when materials, suppliers or energy change, and at least once a year. With the catalogue in one list, updating means changing the rows that changed and recalculating.
Over time, as you add factory energy and supplier data, the whole range moves from screening estimates to footprints with a higher primary data share.
Catalogue carbon footprints: a walkthrough in words
Imagine a supplier with a large range of T-shirts, sweatshirts and trousers across a few factories. Its sales team keeps a spreadsheet with style names, compositions and weights. That sheet is the starting point.
The supplier uploads the list. Each row is read for materials, shares, weight and country. The supplier checks what was read, corrects a few mistyped compositions, and confirms. Rows with a missing weight or country are listed, and the supplier fills them in from the tech packs.
Every style now has a first footprint, split by stage. The supplier sorts the range by what its biggest customers buy and by which products have one dominant stage. For those, it adds factory energy and fabric data. Because one set of energy bills covers every style from that factory, the whole range improves, not just the bestsellers.
The result is a catalogue where every product has a figure, and the ones that matter most carry the most of the supplier's own data.
When a customer then asks for figures on the styles it buys, the supplier does not start from scratch. It filters the catalogue, exports a report and a data file for each style, and sends them the same day it finds them.
Group similar products to save work
Many products in a range differ only in colour or size. Where materials, factory and process are the same, they can share the same inputs, with weight adjusting the result. Treat colourways as one product unless the dyeing route is different.
Group by what drives the footprint: the main fabric, the factory and the wet process. A sweatshirt and a jogger made from the same fleece in the same factory share most of their data. A style made in another factory, or from a different fibre, belongs in a separate group.
Packaging and footwear ranges group in the same way. Boxes in different sizes from the same board and line can share inputs, with weight or area doing the work. Shoe styles built on the same sole and upper materials can share most of their data, with each style's own component weights kept separate.
Keep a product code on each row, so that when a buyer asks about one style you can find its footprint and its group quickly.
Grouping is also where most errors are caught. If two styles in the same group show very different results per kilogram, one of them probably has a wrong weight or composition. Fix the row, not the result.
How buyers read catalogue carbon footprints
Buyers who receive footprints for a whole range read them differently from a single figure. They look for patterns and gaps across the set, so prepare for these checks:
- The unit first. A buyer checks that each figure is per item, per pair or per kilogram as agreed, so it can be multiplied by the quantity bought.
- The boundary. Most expect cradle to gate. Mixing boundaries across a catalogue makes the figures impossible to add up.
- The data year. Buyers want to know which period the figures describe, especially when they compare suppliers.
- The primary data share. A higher share on the products they buy most tells them your figures reflect your own operations.
- Defaults used. Where a weight or country was assumed, buyers want to see it, so they know which figures may change.
- Consistency across styles. Similar products with very different results raise questions. Grouping helps keep the logic clear. You can compare products to spot outliers before sending.
What you can send
Every product gets a footprint split by stage, and each one can be exported as a PDF report and a PACT data file. As you add data, the primary data share rises and the range narrows.
See how it looks across thousands of products in our catalogue and the portfolio view.
Questions
Can colour variants share one footprint?
Usually yes, if materials, factory and dyeing route are the same; give each its own row if the process differs.
What if my products are made in different factories?
Record the country and factory for each row, so each product uses the energy data of the site that made it.
What file format should the product list be?
Excel (.xlsx) or CSV with a header row; a template is provided on the upload page.
Can I footprint all my products at once?
Yes. Upload a product list and each row gets a first footprint; missing details are listed per row.
How precise is a catalogue-wide first pass?
It is a screening estimate. It shows the size and the main stages; your own data narrows it to a figure you can send.
Which products should get detailed footprints first?
Your customers' top sellers and products where one stage dominates.
Keep reading
 For suppliers • CostHow much does a product carbon footprint cost?by Made for Planet Carbon team • 12 Nov 2026 • 5 min read
 For suppliers • Buyer requestsHow to answer a customer's request for a product carbon footprintby Made for Planet Carbon team • 12 Nov 2026 • 6 min read
 Methods & standards • MethodHow to calculate a product carbon footprint, step by stepby Made for Planet Carbon team • 12 Nov 2026 • 7 min read