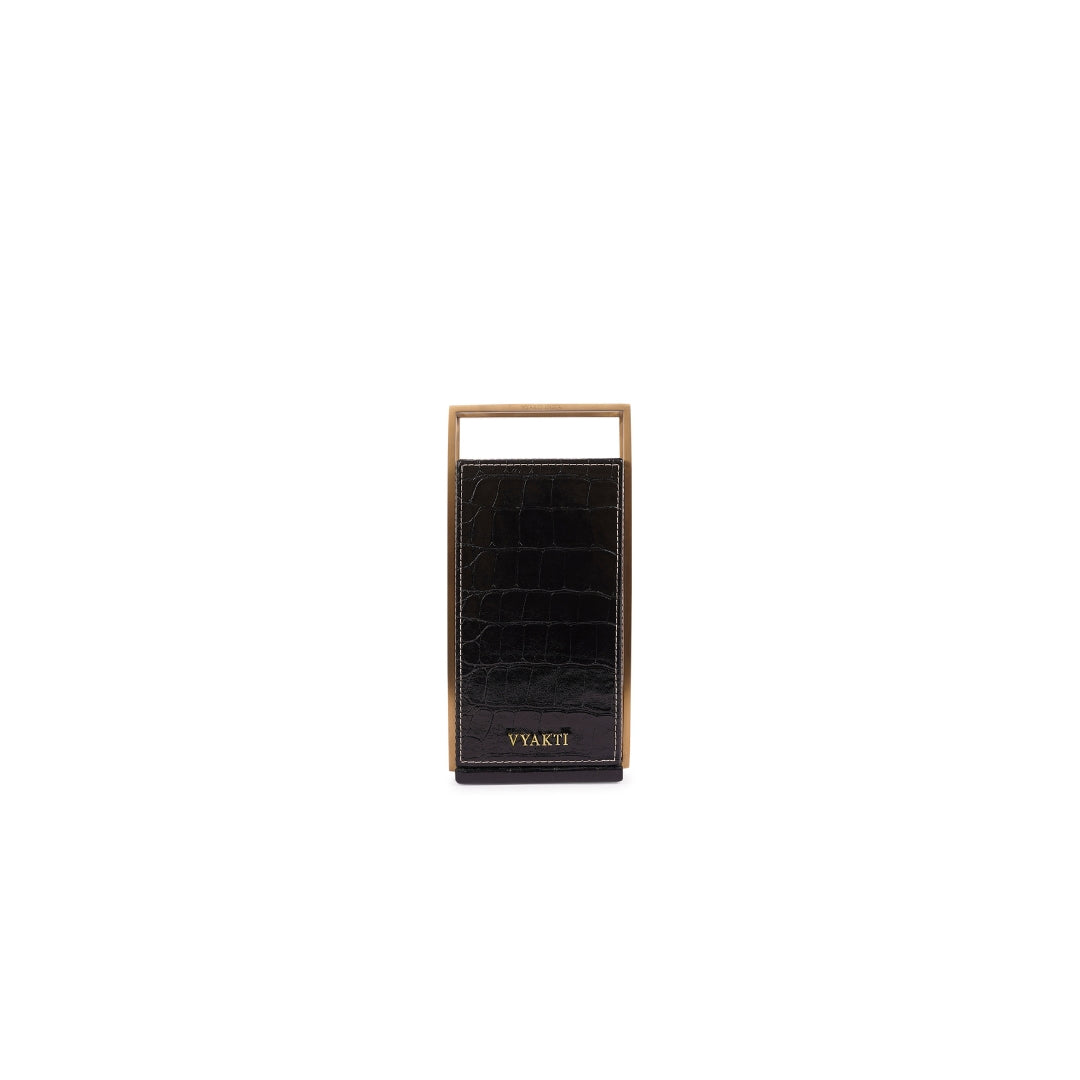
Pitara
Listing says “Olive Leather”
per item, whole life · sold in India · made in India
Change anything below and the footprint recalculates. What you change is marked “Stated”. Nothing here is saved.
| Part | Material (kg CO₂e per kg) | Share % | Mass | Source |
|---|---|---|---|---|
| Material | Family word, assumption applied ⓘ | 300 g | Estimated Primary source |
In everyday terms, about the same as driving 51 km in a petrol car, 1,077 smartphone charges, or 0.4 tree-years of absorption.
How this was calculated
Everything behind the figure, for auditors and the curious. Built to the requirements of ISO 14040/44, ISO 14067 and PACT v3.
Standards checkISO 14040/44, ISO 14067 and PACT v3, requirement by requirement
All 30 requirements, with clauses
| Requirement | ISO 14040/44 | ISO 14067 | PACT v3 |
|---|---|---|---|
| The study's purpose is written down | Met §4.2.2 | Met §6.3.1 | — |
| No public claim that one product beats another | Met §4.2.2; Amd 1 Annex C | Met §Annex A, Annex B | — |
| The unit is clear, and a partial footprint is labelled as such | Met §4.2.3.2 | Met §6.3.3 | Met §3.2.4 |
| The system boundary is described | Met §4.2.3.3 | Met §6.3.4, 7.3 b | Met §3.2.3 |
| The time period is stated and justified | — | Met §6.3.6 | Met §3.2.3 |
| Product category rules are used where they exist | — | Met §6.2 | Met §3.1.2 |
| Anything left out is small, estimated and reported | Met §4.2.3.3.3 | Met §6.3.4.3 | Met §3.3.1.2 |
| The data is checked for consistency | Met §4.3.2–4.3.3 | Met §6.4.3 | — |
| Own processes use measured data, or say why not | — | Met §6.3.5 | Met §4.1.3 |
| Every database value is referenced and fit for purpose | Met §4.3.2 | Met §6.3.5 | Met §4.1.3.2 |
| Shared factory burdens are split by the standard rules | Not applicable §4.3.4 | Not applicable §6.4.6 | Not applicable §3.3.1.4 |
| Recycling is counted with the cut-off method | Met §4.3.4.3 | Met §6.4.6.3 | Met §3.3.2.2 |
| Electricity covers its whole life cycle | Met §4.3.2–4.3.3 | Met §6.4.9.4.1 | Met §3.3.2.3 |
| Electricity follows the market-based rules | — | Met §6.4.9.4.4 | Met §3.3.2.3, Box 7 |
| Land-use change is counted and shown separately factor does not state whether dLUC is covered for m1, pk1, pk2. Fix: Use a factor with a separate dLUC result, or supply material.land_use_change with its value, source, year and whether the material factor already includes it. A documented no-LUC statement can resolve an unknown coverage gap. | — | Not met §6.4.9.5 | Not met §3.3.2.4 |
| Biogenic carbon is counted in and out No carbon content for m1, so its biogenic uptake and content are missing. Fix: Supply measured carbon content for these materials. | — | Not met §6.4.9.2, 6.4.9.3, 6.5.2 | Not met §3.3.2.4 |
| Air freight is shown separately, without radiative forcing | — | Not applicable §6.4.9.7 | Not applicable §3.3.2.1 |
| No offsets or avoided emissions | — | Met §6.3.4.1 | Met §3.3.2.2 |
| Latest IPCC warming factors (AR6, 100 years) 100.0 % of cradle-to-gate emissions use AR5 factors; PACT allows only the latest IPCC report once its grace year has passed. Fix: Replace these factors with AR6-characterised data. | Justified §4.4.2 | Justified §6.5.1 | Not met §3.2.2 |
| Fossil and biogenic methane are kept apart Finished bovine leather, global average incl. cattle farming (economic allocation to hides) (76.6 % of emissions) uses an aggregated factor with no gas split. Its livestock methane, which is biogenic, is counted as fossil, so fossil emissions are overstated and biogenic methane is understated; the total is unaffected. Fix: Use a factor that reports biogenic CH₄ separately, such as a supplier LCA with a gas split. | — | Not met §6.5.2 | — |
| Key choices are stress-tested | Met §4.5.3.3 | Met §6.4.5, 6.6 | — |
| Uncertainty is assessed | — | Met §6.6 | — |
| Data quality is scored | Met §4.2.3.6 | Met §6.3.5 | Met §4.2.2, 4.2.3 |
| Limitations are stated | Met §4.5.4 | Met §6.6, Annex A | — |
| Results are broken down the required way | — | Met §7.2 | Met §3.3.1, data model |
| The study report contains every required item | Met §5.2 | Met §7.3 | — |
| The PACT data file is complete Missing or invalid: companyIds, productIds. Fix: Add company and product identifiers (URNs such as urn:mfp:company:acme), the reference period and a PACT unit. | — | — | Not met §6.1; Tech Specs v3.0.3 |
| The primary data share is reported | — | — | Met §4.2.2 |
| Independent critical review No critical review recorded. Fix: Commission an ISO 14071 critical review before any public communication; a panel review is mandatory for public comparisons. | Needs reviewer §6 | Needs reviewer §8 | — |
| Third-party verification of the calculation model The MFP footprint calculation model has not yet been verified by a third party. Fix: Commission limited-assurance verification of the calculation model (PACT v3 §5.3.3, Tables 14–15). | — | — | Needs reviewer §5.3.3 |
These standards apply to studies. This checklist reports the implemented checks; it is not certification or a substitute for independent review. “Needs reviewer” items (critical review, verification of the calculation model) can only be closed by an independent third party.
Assumptions and defaults21 entries, 4 warnings
- Leather carbon content has no verifiable public value; biogenic carbon reporting excludes leather.
- Grid electricity uses location-based national or regional averages. PACT v3 and Catena-X require the market-based residual mix where contractual instruments exist; supply electricity_factor for contracted or residual-mix power.
- Biogenic carbon content 0.0% of product mass is below 5 %: PACT allows omitting biogenic uptake; both figures are still reported.
- Temporal scores for desnz_2025 use the edition year; their underlying data are older, so those temporal scores may be better than the data deserve.
Assumptions register · 21 entries
- Screening mode: this listing gives no primary data, so every input below that is not a stated material or weight is a named screening default. The result is not PACT-conformant (primary data share 0 %).
- Product mass 0.3 kg is a category typical value for "accessory", not a measured weight.
- Country of manufacture not stated in the listing; India assumed.
- m1: bovine leather modelled with the global average of Brugnoli et al. 2025 (cattle farming allocated to the hide by economic value); UNIDO's figures with farming fully allocated and tannery-only are shown in the sensitivity table. Listing mass converted at 0.941 kg/m², the study's own conversion.
- m1: material matched from "leather" (family, MEDIUM confidence): 'leather' with no qualifier is treated as bovine leather.
- m1: material share 100 % is estimated from the listing text.
- Packaging not stated; screening default for accessory: Paper bag / wrap 50 g paper, recycled, Shipping box (share) 80 g corrugated board.
- Cutting, stitching & finishing: Bag / small leather goods assembly energy: 2 kWh per item (Default assumption (cut, stitch, finish)).
- Process energy is unmetered screening data (activity uncertainty GSD 1.5–2.0), on the IN grid.
- Inbound transport of materials to the factory is left out of the total, because supplier locations are unknown; its likely size is estimated and reported under the cut-off rule below.
- Distribution route is a screening default (1,000 km road), carrying product plus packaging.
- m1: no landfill factor for bovine_leather in the library; eol_landfill_clothing used as a proxy.
- m1: bovine_leather has no verified carbon content, so its incineration share is modelled as landfill.
- Cut-off rule: processes are excluded only where no verified data exists, and each exclusion is estimated where possible and reported (ISO 14044 §4.2.3.3.3). Inbound transport is estimated at 0.0188 kg CO₂e.
- Paper/board carbon: IPCC 2006 Vol.5 Table 2.4 defaults (90 % dry matter, 46 % C of dry, 1 % fossil).
- Secondary (library) factors are scored at least 3 on technology: PACT v3 Table 12 reserves scores 1-2 for primary data.
- Use-phase scenario: No energy-using use phase for accessory.
- End-of-life route shares: MFP screening scenario for India, not PEFCR: textiles and leather goods 80 % landfill / dump, 5 % burning; plastics 60 % / 10 %; paper 40 % / 5 %; metals and glass 50 % landfill; the rest recovered (cut-off). Anchored on CPCB Annual Report on Solid Waste Management 2021-22 (24 % landfilled, 22 % unaccounted).
- Incineration: 100 % oxidation of carbon assumed (IPCC 2006 Vol.5 Ch.5 default oxidation factor for MSW incineration). Energy-recovery credits are not applied under cut-off.
- Aggregated secondary factors are used as published in their own GWP basis (AR5); only gas-split fuel factors and direct gas emissions are characterised with AR6. Residual inconsistency is typically a few percent for CO2-dominated factors.
- Sources quoted as published figures (not open-licensed datasets): brugnoli_2025. Replace with licensed or supplier data before external or comparative claims.
SensitivityThe figure with other published choices
The footprint recalculated with each alternative choice: other published factors, the other allocation method, the grid mix instead of a green-power contract, and the use profile at its uncertainty bounds. A large change shows where better data pays off first.
| Line | Choice tested | Baseline | Alternative | Δ kg CO₂e | Δ % |
|---|---|---|---|---|---|
| Bovine leather | Emission factor | Finished bovine leather, global average incl. cattle farming (economic allocation to hides) | Finished bovine leather incl. cattle farming UNIDO Leather Carbon Footprint (citing Knoedler) | +28.483 | +330.4% |
| Bovine leather | Emission factor | Finished bovine leather, global average incl. cattle farming (economic allocation to hides) | Finished bovine leather, slaughterhouse to tannery gate UNIDO Leather Carbon Footprint (citing Knoedler) | -1.180 | -13.7% |
Every line of the calculation15 lines: activity × factor, with sources
Footprint = Σ activity × emission factor
Every line: how much (activity) × how much CO₂e per unit (factor), with its source. Source labels
| Stage | Line | Activity | × Factor | = kg CO₂e | DQR | Source |
|---|---|---|---|---|---|---|
| Raw materials | Bovine leather bovine_leather (virgin) | 0.319 m2 | 20.7 kg/m2 | 6.602 | 3/4/4 Low · +288% | Primary source Brugnoli F., Sena K., Zugno L., Oggioni A. (2025). A global study on the Life Cycle Assessment (LCA) of the modern cow leather industry. Discover Sustainability 6:80. doi:10.1007/s43621-025-00798-6 (open access). Table 9; Table 6; Table 12; database · 2025 |
| Packaging | Paper bag / wrap paper (100% recycled, cut-off) | 0.050 kg | 1.05 kg/kg | 0.053 | 3/5/1 Medium · +271% | Pin to primary UK DESNZ GHG conversion factors 2025, Material use database · 2025 (flat file) |
| Packaging | Shipping box (share) corrugated_board (virgin) | 0.080 kg | 1.2 kg/kg | 0.096 | 3/5/1 Medium · +271% | Pin to primary UK DESNZ GHG conversion factors 2025, Material use database · 2025 (flat file) |
| Production | Cutting, stitching & finishing grid electricity IN | 2.000 kWh | 0.8135 kg/kWh | 1.627 | 3/1/1 High · +554% | Pin to primary Ember via Our World in Data, carbon intensity of electricity database · 2026 release (2025 data) |
| Distribution | Road to customer (India) HGV (all diesel), all HGVs, average laden, 1000 km | 0.430 t·km | 0.1252 kg/t·km | 0.054 | 3/5/1 Medium · +309% | Pin to primary UK DESNZ GHG conversion factors 2025, Freighting goods + WTT delivery vehicles database · 2025 (flat file) |
| End of life | Bovine leather to recycling (cut-off: collection only) | 0.045 kg | 0.004686 kg/kg | 0.000 | 3/5/1 Medium · +271% | Pin to primary UK DESNZ GHG conversion factors 2025, Waste disposal (open/closed loop, combustion) database · 2025 (flat file) |
| End of life | Bovine leather to landfill | 0.255 kg | 0.4968 kg/kg | 0.127 | 3/5/1 Medium · +271% | Pin to primary UK DESNZ GHG conversion factors 2025, Waste disposal database · 2025 (flat file) |
| End of life | Paper bag / wrap to recycling (cut-off: collection only) | 0.027 kg | 0.004686 kg/kg | 0.000 | 3/5/1 Medium · +271% | Pin to primary UK DESNZ GHG conversion factors 2025, Waste disposal (open/closed loop, combustion) database · 2025 (flat file) |
| End of life | Paper bag / wrap to incineration: collection | 0.003 kg | 0.004686 kg/kg | 0.000 | 3/5/1 Medium · +271% | Pin to primary UK DESNZ GHG conversion factors 2025, Waste disposal (open/closed loop, combustion) database · 2025 (flat file) |
| End of life | Paper bag / wrap incineration fossil CO2 (stoichiometric, full oxidation) | 0.003 kg | 0.01517 kg/kg | 0.000 | 1/1/1 High · +0% | Computed Carbon mass balance (this engine) computed |
| End of life | Paper bag / wrap to landfill biogenic non-CO₂ (landfill methane) | 0.020 kg | 1.164 kg/kg | 0.023 | 3/5/1 Medium · +271% | Pin to primary UK DESNZ GHG conversion factors 2025, Waste disposal database · 2025 (flat file) |
| End of life | Shipping box (share) to recycling (cut-off: collection only) | 0.044 kg | 0.004686 kg/kg | 0.000 | 3/5/1 Medium · +271% | Pin to primary UK DESNZ GHG conversion factors 2025, Waste disposal (open/closed loop, combustion) database · 2025 (flat file) |
| End of life | Shipping box (share) to incineration: collection | 0.004 kg | 0.004686 kg/kg | 0.000 | 3/5/1 Medium · +271% | Pin to primary UK DESNZ GHG conversion factors 2025, Waste disposal (open/closed loop, combustion) database · 2025 (flat file) |
| End of life | Shipping box (share) incineration fossil CO2 (stoichiometric, full oxidation) | 0.004 kg | 0.01517 kg/kg | 0.000 | 1/1/1 High · +0% | Computed Carbon mass balance (this engine) computed |
| End of life | Shipping box (share) to landfill biogenic non-CO₂ (landfill methane) | 0.032 kg | 1.164 kg/kg | 0.037 | 3/5/1 Medium · +271% | Pin to primary UK DESNZ GHG conversion factors 2025, Waste disposal database · 2025 (flat file) |
| Total, excluding biogenic uptake | 8.620 |
ISO 14067 study reportSeparately reported values and report contents
ISO 14067 study report · Carbon footprint (cradle-to-grave, functional unit)
| Footprint per one accessory delivered and used to the end of its life, sold in India (ISO 14067, incl. biogenic −1/+1) | 8.4343 kg CO₂e |
| Net fossil GHG | 8.5592 kg CO₂e |
| Biogenic CO₂ emissions | 0.0098 kg CO₂ |
| Biogenic CO₂ removals | -0.1952 kg CO₂ |
| Biogenic CH₄ (as CO₂e) | 0.0606 kg CO₂e |
| Direct land-use change | 0.0000 kg CO₂e |
| Aircraft (no radiative forcing) | 0.0000 kg CO₂e |
| Biogenic carbon content | 0.0000 kg C |
| Outbound logistics (reported separately) | 0.0538 kg CO₂e |
| Raw materials | 6.6025 kg · 76.6% |
| Production | 1.6270 kg · 18.88% |
| Inbound transport | 0.0000 kg · 0% |
| Packaging | 0.1485 kg · 1.72% |
| Distribution | 0.0538 kg · 0.62% |
| Use phase | 0.0000 kg · 0% |
| End of life | 0.1879 kg · 2.18% |
| Goal: application, reasons, audience, comparative assertion §6.3.1 / 14044 4.2.2 | Screening carbon footprint shown on the Made for Planet catalogue so brands and buyers can see where a product's emissions come from. Reasons: No company data is available for this listing; a transparent estimate from the listing and published factors shows the likely size and the main stages. Audience: Brands and buyers (business-to-business). The estimate is also displayed on madeforplanet.com, labelled as a screening estimate; it is not an environmental claim the brand may use in marketing. Public comparative assertion: no. |
| Functional or declared unit and reference flow §7.3 a | Functional unit: one accessory delivered and used to the end of its life, sold in India; reference flow 0.3 kg of product. |
| System boundary §7.3 b | cradle to grave. Screening: materials, processing energy, packaging, distribution, use and end of life. Capital goods are excluded, as is usual for attributional product footprints. Stages modelled: raw_materials, packaging, production, distribution, end_of_life. |
| Significant unit processes §7.3 c | bovine_leather (virgin) (76.6 %); assembly: grid electricity IN (18.88 %) |
| Data sources §7.3 d | Brugnoli et al. (2025) A global study on the LCA of leather, Discover Sustainability 6:80 2025; UK DESNZ Greenhouse gas reporting: conversion factors 2025 2025 (flat file); Carbon intensity of electricity (Ember via Our World in Data) 2026 release (2025 data) |
| Greenhouse gases considered §7.3 e | CO₂, CH₄ (fossil and biogenic), N₂O and refrigerant gases (HFCs, SF₆, NF₃) where present; secondary factors cover the gases their publishers include. |
| Characterisation factors §7.3 f | IPCC AR6 GWP100 with climate-carbon feedbacks; secondary factors in their published basis where no AR6 version exists (see gwp check). |
| Cut-off criteria and exclusions §7.3 g, o | Inbound transport of materials to the factory: 0.018783 kg CO₂e (screening estimate: 0.300 kg of materials × 500 km by average lorry (UK DESNZ GHG conversion factors 2025, Freighting goods + WTT delivery vehicles); supplier locations are not known) |
| Allocation procedures §7.3 h | No multi-output processes. Recycling: cut-off. |
| Timing of emissions §7.3 i, 6.4.8 | All emissions and removals counted as at the start of the assessment period; no delayed-emission weighting. |
| Data description and quality §7.3 j | PACT Table 12 DQR: technological 3, geographical 3.48, temporal 3.3; per-line scores, confidence and 95 % uncertainty in the inventory. |
| Sensitivity and uncertainty §7.3 k | 2 sensitivity case(s); lognormal Monte Carlo on pedigree uncertainty. |
| Electricity treatment §7.3 l | IN: grid location (India electricity, life-cycle intensity 2025) |
| Interpretation, limitations §7.3 m, Annex A | Climate change only: other impacts (water, land, toxicity, biodiversity) are not assessed, so a lower footprint does not mean a lower environmental impact overall. Secondary factors limit accuracy as shown by the data-quality scores. |
| Value choices §7.3 n | Cut-off for recycling (PACT); economic allocation only above a 5× value ratio; conservative factor where published values disagree (see sensitivity). |
| Scope changes and exclusions §7.3 o | None. |
| Life-cycle stages, use and end-of-life scenarios §7.3 p, 6.3.7, 6.3.8 | Use-phase scenario: No energy-using use phase for accessory. End-of-life route shares: MFP screening scenario for India, not PEFCR: textiles and leather goods 80 % landfill / dump, 5 % burning; plastics 60 % / 10 %; paper 40 % / 5 %; metals and glass 50 % landfill; the rest recovered (cut-off). Anchored on CPCB Annual Report on Solid Waste Management 2021-22 (24 % landfilled, 22 % unaccounted). |
| Influence of alternative scenarios §7.3 q | factor_choice m1: 330.4 %; factor_choice m1: -13.7 % |
| Period the footprint represents §7.3 r, 6.3.6 | 2026-01-01 to 2026-12-31: current production as represented by the factor library (each factor's own data year is scored in the temporal data quality) |
| Product category rules §7.3 s, 6.2 | No product category rules conforming to ISO/TS 14027 are known for this product category; MFP screening rules are applied and disclosed. |
| Performance tracking §7.3 t, 6.4.7 | Not a performance-tracking study. |
ISO 14067 counts biogenic removals (−1) and emissions (+1) in the carbon footprint; the PACT headline excludes biogenic uptake. Both are shown.
PACT v3 data and biogenic carbonData-exchange values and a downloadable file
PACT v3 data model (cradle-to-gate) and biogenic carbon balance
Download PACT v3.0.3 JSON ProductFootprint in the Technical Specifications v3.0.3 format (decimals as strings). Check the conformance panel before sending it.
| Footprint excl. biogenic uptake | 8.3780 kg CO₂e |
| Footprint incl. biogenic uptake | 8.1828 kg CO₂e |
| Fossil GHG emissions | 8.3780 kg CO₂e |
| Land-use change GHG | — |
| Biogenic non-CO₂ | 0.0000 kg CO₂e |
| Biogenic CO₂ uptake | -0.1952 kg CO₂ |
| Fossil carbon content | 0.0000 kg C |
| Biogenic carbon content | 0.0000 kg C |
| Aircraft GHG (no RF) | 0.0000 kg CO₂e |
| Packaging GHG | 0.1485 kg CO₂e |
| Exempted emissions | 0.2240 % |
| Primary data share | 0.0000 % |
| IPCC characterisation | AR6, AR5 |
| Biogenic CO₂ uptake | -0.1952 kg CO₂ |
| Biogenic CO₂ emitted | 0.0098 kg CO₂ |
| Biogenic C stored in landfill | 0.0213 kg C |
| Biogenic C exported to recycling | 0.0293 kg C |
| Biogenic C in product | 0.0000 kg C |
| Engine / factor library | 1.2.0 / 2026.11-mfp.8 |