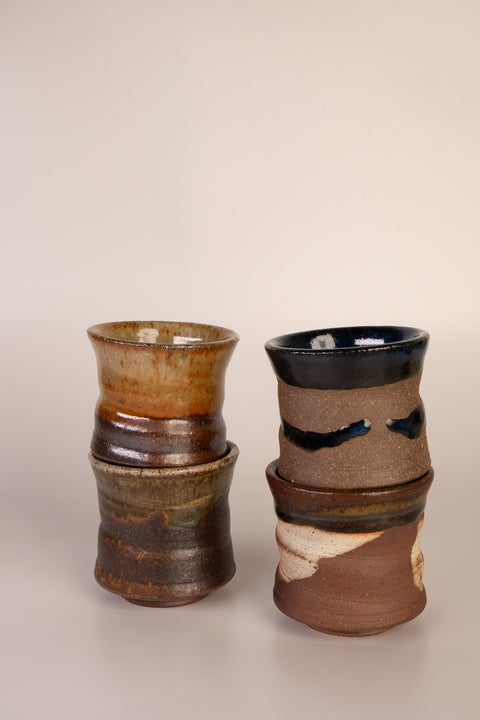
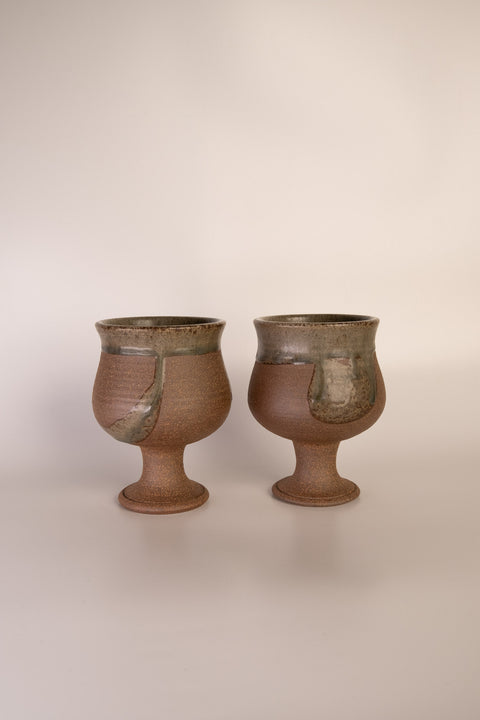
GLINT SHOT GLASSES - SET OF 4
3.10kg CO₂e per kg, to factory gateEstimate · low confidence
We have estimated the carbon footprint of 48 The Santra Project products across 11 kinds of product. Open any product to see its footprint split by life-cycle stage, with the source of every figure.
Whole-life footprint per item. Compare within a row, not across rows: a jacket and a pair of socks do different jobs and are not comparable.
| Kind of product | Median, kg CO₂e per item | Products |
|---|---|---|
| T-shirt · typical T-shirt | 5.36 | 8 |
| Mug / cup | 1.08 | 6 |
| Home and kitchen item | 4.70 | 4 |
| Shirt · typical shirt | 6.93 | 4 |
| Trousers · typical pair of trousers | 11.5 | 3 |
| Plate / platter | 1.38 | 3 |
| Garment | 7.78 | 3 |
| Dress · typical dress | 9.03 | 3 |
| Bowl | 0.78 | 3 |
| Shorts / skirt · typical pair of shorts or skirt | 6.53 | 3 |

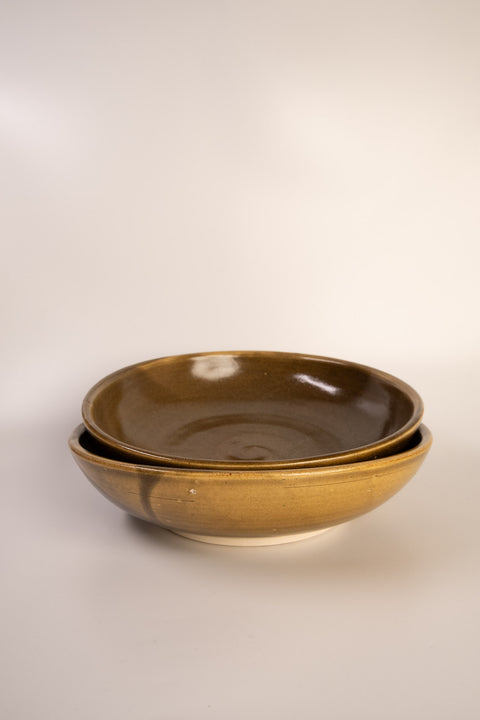
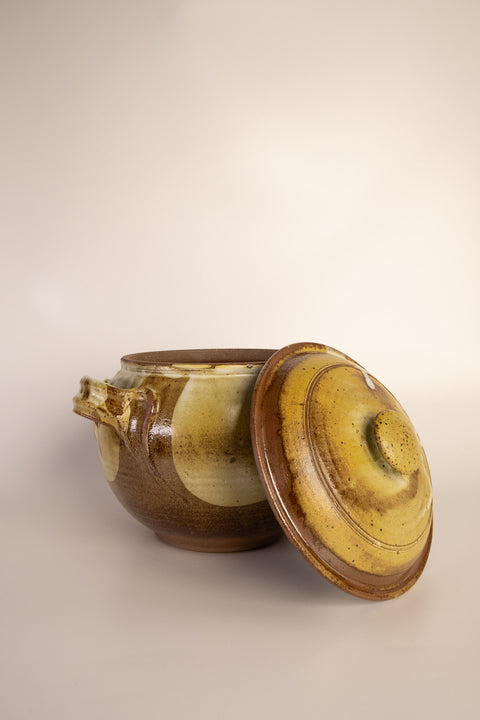


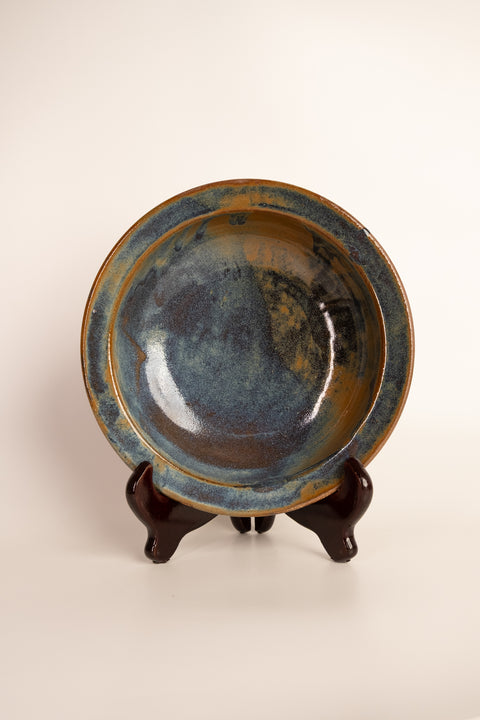


These are screening estimates that we made from the product listings: materials and weight as listed, emission factors from cited public sources, and the ISO 14067 method. They are not the brand's own factory data, and the brand has not supplied or checked them. The brand or its suppliers can replace them with a footprint built on their own data.
Are you a maker or supplier? Start with a free estimate for your own product, or read what a product carbon footprint is.